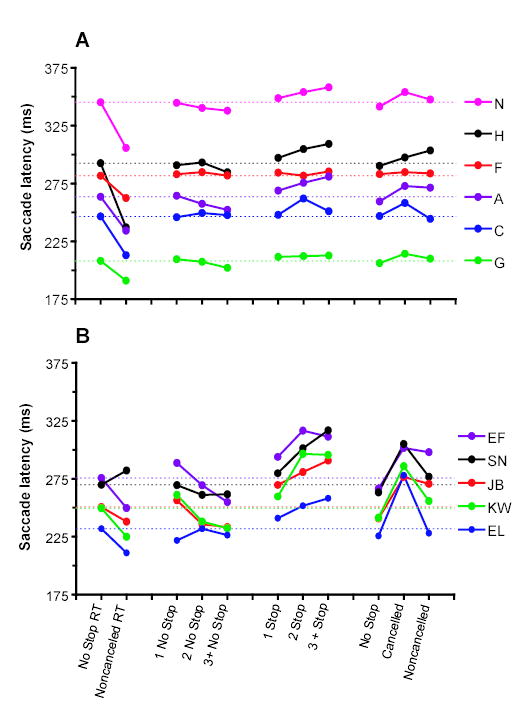
Figure 3.

The influence of recent trial history on response time on no stop signal trials. The first columns represent the mean no stop signal response time and the mean noncancelled response time. All other columns represent the mean no stop signal reaction time for trials with the sequences of preceding trials indicated on the abscissa. The mean no stop signal reaction time for each subject is represented by the horizontal dotted line.
