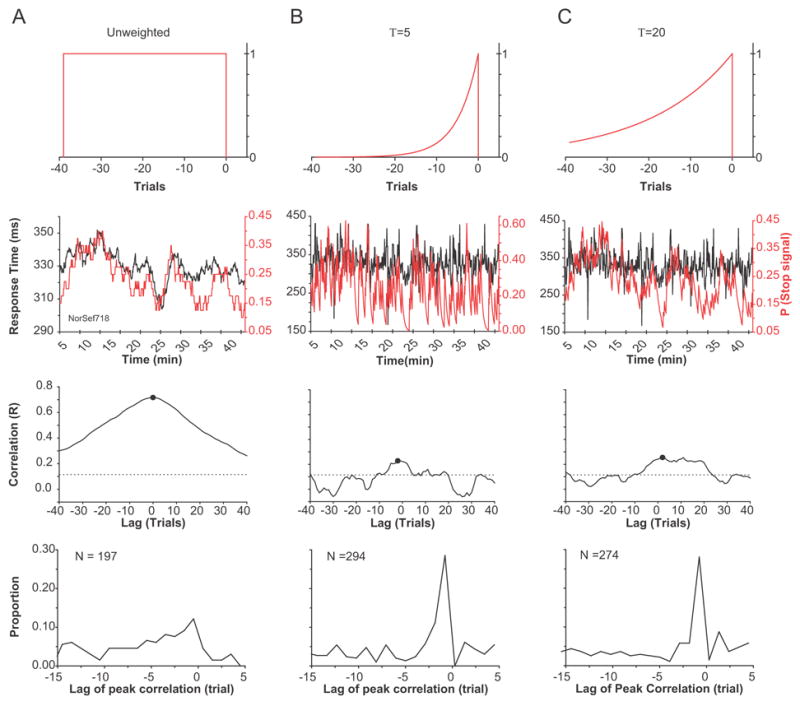
Figure 4.

Cross-correlation between moving averages of the fraction of stop signal trials and response time in the preceding 40 trials. (A) Example of temporal correlation between local fraction of stop signal trials and response time. The top row of figures are schematics of the functions used to convolve the response times and stop fractions. The first, second, and third columns represent unweighted and weighted means with time constants of 5 and 20 trials, respectively. (B) Correlation coefficient of stop fraction with response time shifted the number of trials at that point on the ordinate. The circle is the maximum correlation coefficient. The dashed line defines the two-tailed 99% confidence limit. (C). Distribution of the lags at which the cross correlation between moving averages of response time and the fraction of stop signal trials was maximized.
