
Figure 6.
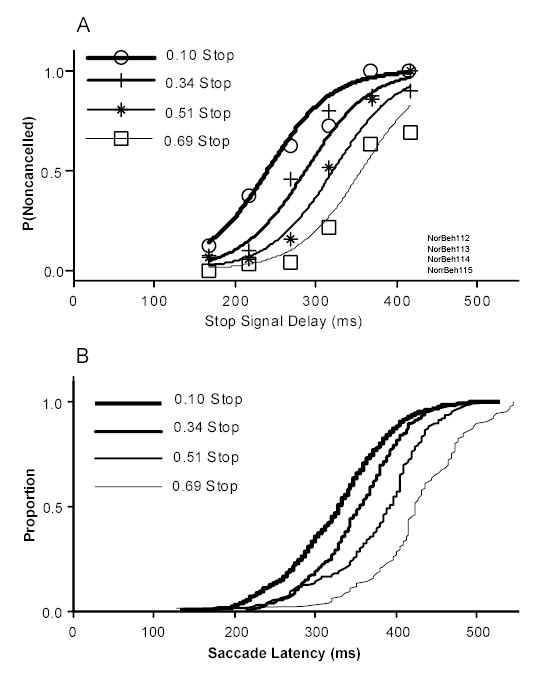
The effect of varying the global probability of a stop signal trials on the probability of responding and response time on no stop signal trials for monkey N. (A) The probability of responding was fit with logistical models with stop signal delays and the global stop ratio as factors, log [P/(1-P)] = b0 + b1*SSD + b2 * STOP RATIO, and with only the stop signal delay as a factor, log [P/(1-P)] = b0 + b1*SSD. A significant effect of trial history is indicated by a fit plotted for each inhibition function. Leftward shifts in the curves indicate a lower probability of responding. (B) Cumulative density functions of no stop signal reaction times as a function of stop ratio. The distributions are significantly different (Kruskal-Wallais test, p<0.05).