
Figure 5.
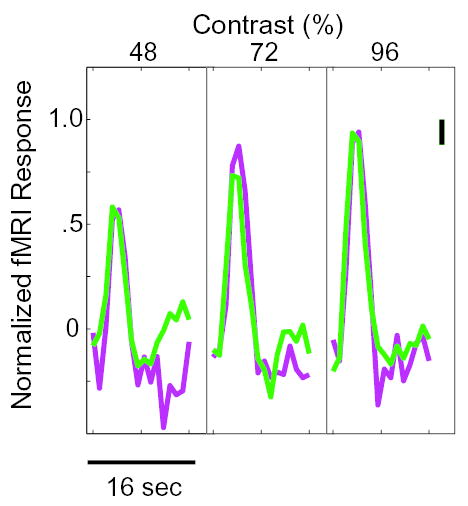
Results of Experiment 2 in V1. A. Average hemodynamic responses from spaced (3 sec SOA, pink curve) and rapid (1 sec SOA, green curve) designs. The black bar spans the size of the average standard error of the mean.
Official websites use .gov
A
.gov website belongs to an official
government organization in the United States.
Secure .gov websites use HTTPS
A lock (
) or https:// means you've safely
connected to the .gov website. Share sensitive
information only on official, secure websites.
Results of Experiment 2 in V1. A. Average hemodynamic responses from spaced (3 sec SOA, pink curve) and rapid (1 sec SOA, green curve) designs. The black bar spans the size of the average standard error of the mean.