
Figure 3.
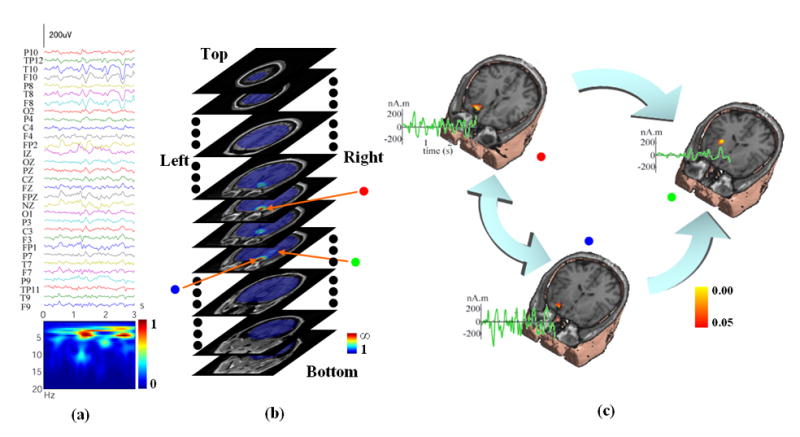
(a) 3-seconds-long 31-channel scalp waveforms from Fig. 1 for subspace source localization analysis. (b) Example of a 3D scanning result by FINE for an ictal activity (Fig. 1, Patient #1) displayed with gray MRI slices. The pseudo-colors show the reciprocal of subspace correlation (SC). Red: low SC; Blue: high SC. The extent of pseudo-colors indicates the coverage of the possible solution space. Three identified sources in the 3D scanning are marked with red, blue, and green dots, respectively. (c) Locations (pseudo-colors on MRI images), waveforms (green curves), and causality patterns (big arrows) for identified sources from Fig. 3(b).