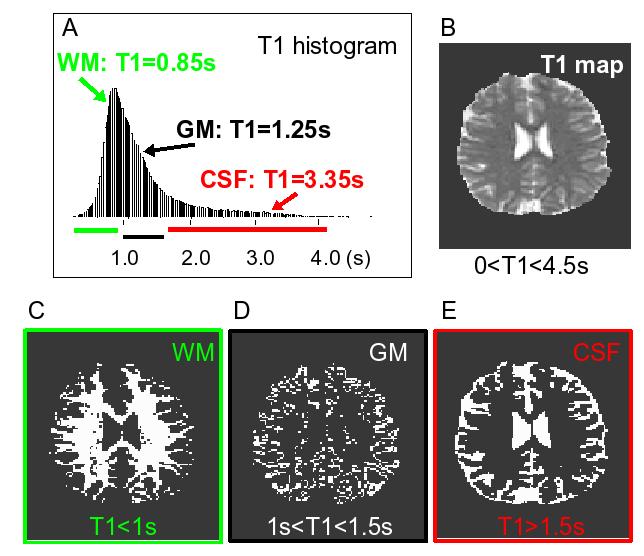
Figure 3.

An example of the echo planar image segmentation is shown. a) A histogram of the T1 values from all voxels in all subjects (n=111726) is shown. The colored horizontal lines represent the T1 ranges used for segmentation; b) An example of single slice T1 map is shown. Grey scale display range: 0s (black) to 4.5s (white). Examples of the resulting binary segmentation masks are also shown: c) white matter (WM); d) gray matter (GM); e) cerebrospinal fluid (CSF).
