
Figure 5.
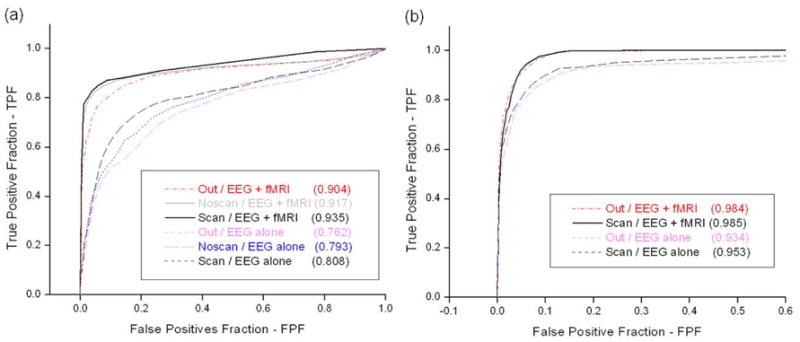
ROC curves with respect to fMRI activations: (a) Subject JS; (b) Subject VG. The abbreviations are the same as defined in Figure 1. Values in parentheses represent areas below ROC curves.
Official websites use .gov
A
.gov website belongs to an official
government organization in the United States.
Secure .gov websites use HTTPS
A lock (
) or https:// means you've safely
connected to the .gov website. Share sensitive
information only on official, secure websites.
ROC curves with respect to fMRI activations: (a) Subject JS; (b) Subject VG. The abbreviations are the same as defined in Figure 1. Values in parentheses represent areas below ROC curves.