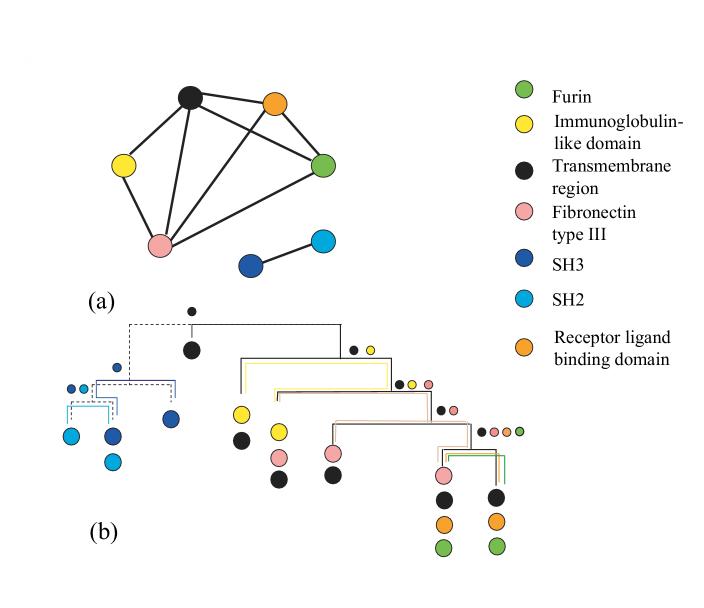
Figure 2.
a) The domain overlap graph for selected domains from the human tyrosine kinase family. Chosen domains belong to more than one architecture (under assumption that architectures containing the same set of domains are considered to be the same). The kinase domain is omitted since it is present in all these architectures. b) Representation of the domain overlap graph as an intersection graph of subtrees of a tree. The correspondence between subtrees and domains is indicated by corresponding colors. The label of a node indicates which subtrees intersect in this node.

