
Figure 5.
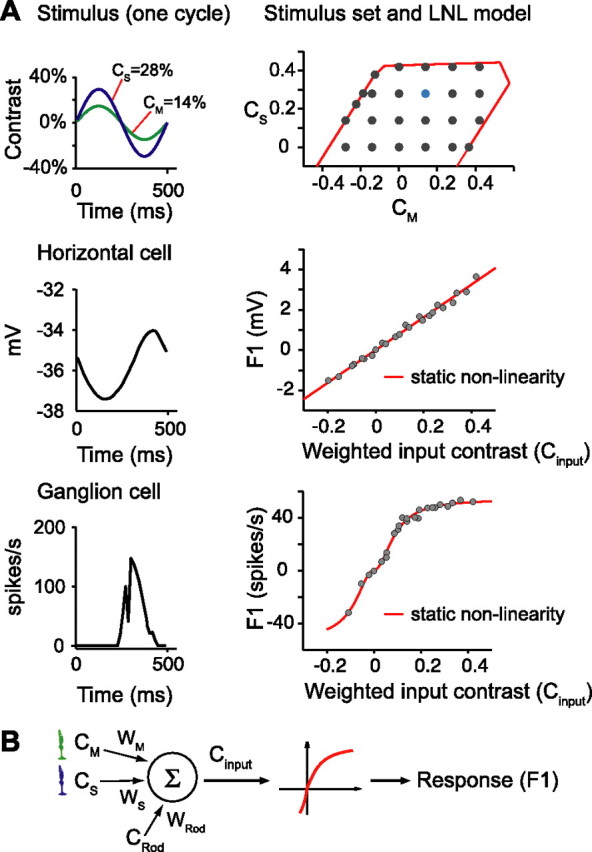
LNL model describes the responses of cells to flicker and was used to estimate M- and S-cone weights.A, Responses to flicker. Left column shows a stimulus (top) that sinusoidally modulates excitation of M and S opsins against a uniform background and the responses of a horizontal cell (smoothed membrane potential, middle) or a ganglion cell (peristimulus time histogram, bottom panel) to this stimulus. Right column shows a set of sinusoidally modulated stimuli (top, M and S contrasts plotted; cyan dot, the stimulus shown on the left; red line is the gamut limitation of our display) and how the F1 responses to these stimuli (gray dots) for horizontal and ganglion cells (middle and bottom) were described by the LNL model (see B and Appendix C). The derived static nonlinearity for the horizontal cell was essentially linear over the range of contrasts used, whereas the ganglion cell showed clear saturation.B, Linear nonlinear model. The linear component of the model used a weighted sum of receptor contrasts as Cinput. The nonlinear component predicted the response (F1) of the cell from Cinput through a parameterized static nonlinearity. Cone weights and parameters describing the static nonlinearity were found through numerical search by minimizing the difference between model prediction (red line) and responses (gray dots) (right middle and right bottom plots in A). To correct for rod contribution to cell response, the rod contrast weight was set at a fixed value before fitting the cone weights and parameters of the nonlinearity. In Appendix C, we show that the fit quality and derived nonlinearity are independent of the rod contrast weight assumed. We used the data from the flash experiments to set the value for the rod contrast weight.