
Figure 1.
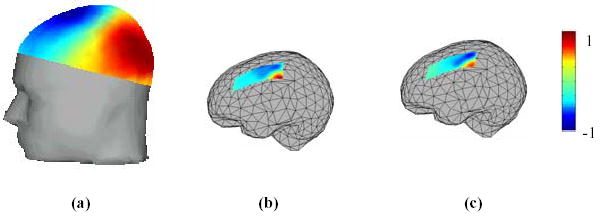
An example of cortical potential imaging in a human subject. (a) Scalp potential map at 30 ms after the onset of right median nerve stimuli; (b) the estimated cortical potential map at latency 30 ms; (c) the direct recorded subdural grid potentials at latency of 30 ms following open-skull surgery. All the maps are normalized and the colorbars are shown on the right. The correlation coefficient between the estimated and recorded subdural grid potentials is 84%. (Revised from [21] with permission)