
Figure 4.
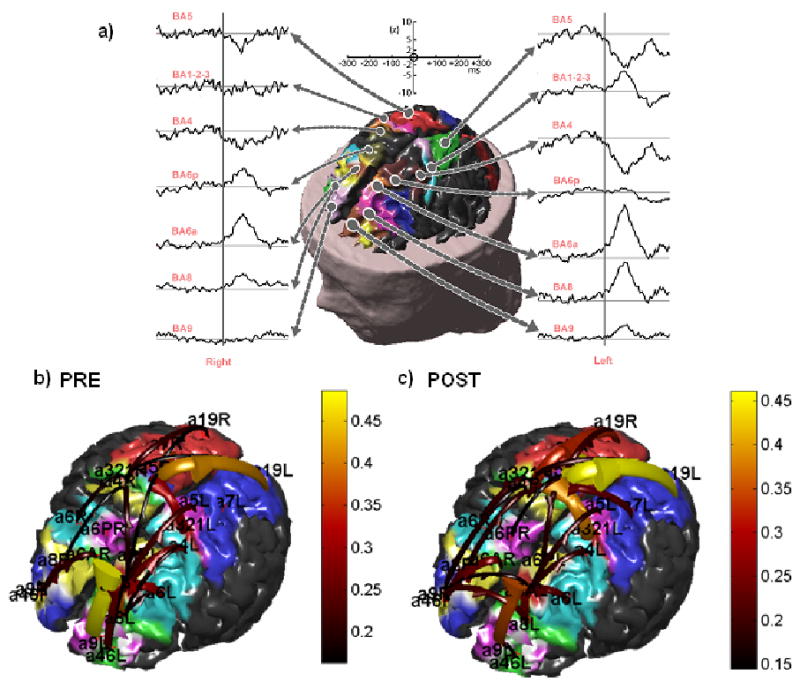
a) Estimates of the statistical significance of the cortical activity in selected ROIs depicted on the realistic representation of the cortex in a human subject. Such estimation was performed first by estimating the cortical activity with the use of the a priori information from fMRI during the solution of the linear inverse problem. Then, in order to obtain the statistical significance of cortical estimated waveforms, the z-score transformation was first applied and then represented. Note the z-score scale of the waveforms, ranging from 0 (the baseline) to 10; this latter value corresponding to a level of statistical significance equal to p < 10−7. The figure at the center shows the different ROIs drawn on different colors on the cortical surface reconstruction of the subject. b, c) Connectivity patterns estimated in the alpha frequency band by application of DTF on the estimated cortical waveforms in one subject. The connectivity estimates are relative to the period before the EMG onset b) and from the EMG to the end of recordings c). Each pattern is represented with arrows moving from one cortical area toward another. The color and size of the arrows code the level of strength of the functional connectivity observed between ROIs. The labels indicate the names of the ROIs employed. (from ref [12] with permission)