Figure 3.
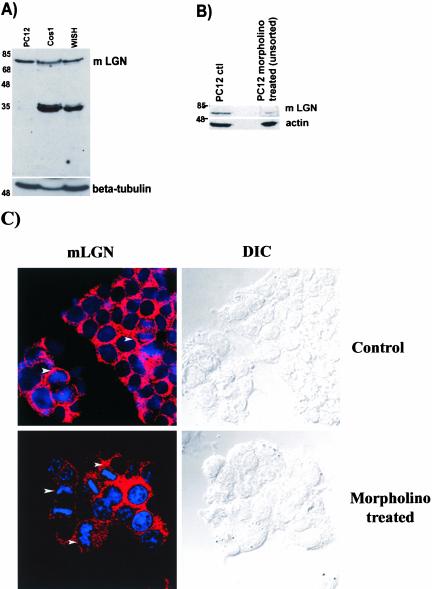
Immunoblot analysis. Total protein extracts, 100 μg, were loaded in each lane and immunoblotted. (A) Protein extracts from PC12, COS, and WISH cell lines were probed with anti-LGN antibody at a concentration of 1 μg/ml. Anti-LGN detects a prominent band of the expected LGN molecular weight in the PC12 extract. COS and WISH cell extracts show the LGN band and other additional lower size bands. β-Tubulin is used as a protein-loading marker. (B) An immunoblot of PC12 cell extracts before and after morpholino treatment. The intensity of the LGN band is reduced fivefold upon morpholino treatment compared with that of the control untreated PC12 cells. In this immunoblot, actin was used as a protein-loading marker. (C) Confocal and DIC images of control and morpholino-treated PC12 cells stained with anti-LGN (red) and DNA (blue). Arrowheads indicate cells in mitosis showing cortical LGN staining in control cells but not in the morpholino-treated cells.

