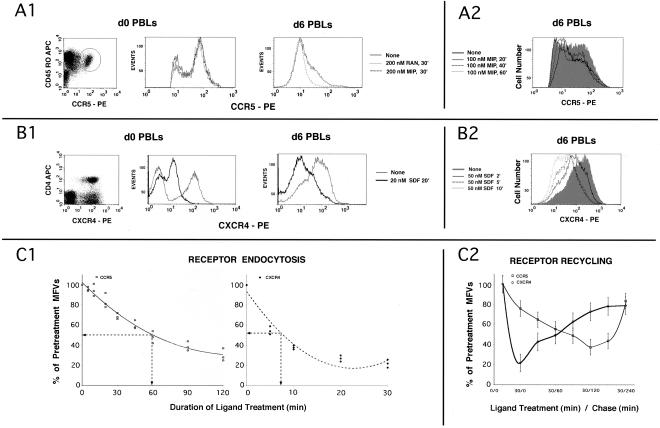
Figure 1.
(A and B) Kinetics of agonist-induced internalization of CCR5 and CXCR4, respectively, in PBLs; (C) CKR internalization and recycling in expression systems. (A1) d0 PBLs represent CD4+ T cells. Bivariate analysis of the CD4+ subset stained with CCR5 mAb 3A9-PE and CD45RO-APC is shown on the left. CCR5+ subset is encircled. Cells were stimulated with RANTES (RAN), MIP-1β (MIP) or untreated and the overlaid FACS histograms of the CCR5+ subset are shown immediately to the right. d6 PBLs are CD3 positive. Overlaid CCR5 histogram profiles of stimulated and untreated d6 PBLS are on the far right. (A2) Kinetics of MIP-1β induced CCR5 downmodulation. Overlaid FACS histograms of cells treated for various times or untreated (shaded graph) are shown. CCR5 gating parameters were adjusted to exclude low-expressers (cutoff value of ∼0.5 log). (B1) Bivariate analysis of CD3+ subset stained with CXCR4 mAb 12G5-PE; CD4-APC is on the left. CXCR4 histograms of d0 and d6 PBLs treated with SDF-1α or untreated are shown in the next two panels. (B2) Kinetics of CXCR4 downmodulation by SDF-1α. CXCR4 staining profiles of cells treated for various times or untreated (shaded graph) are shown. (C1) Receptor internalization using a HEK293 cell line expressing CCR5 and a cloned HeLa-CD4 line expressing high levels of CXCR4. Cells were stimulated with the respective chemokines (AOP-RANTES at 200 nM for CCR5; 20 nM SDF-1α for CXCR4) for the indicated times, and the MFVs of different receptors were determined by FACS analysis. Data are expressed as percentage of initial MFVs as a function of duration of chemokine treatment. Data from three experiments were used to fit a polynomial curve. (C2) For receptor recycling experiments, cell lines (noted above) expressing the indicated receptor(s) were treated with protein synthesis inhibitors before and during the experiment. CCR5 was stimulated for 30 min at 100 nM of MIP-1β and CXCR4 with 50 nM SDF-1α. MFVs of receptors at various times during the experiment are plotted as percent of MFVs of pretreated cells on the ordinate (with error bars) with time of the experiment on the abscissa.

