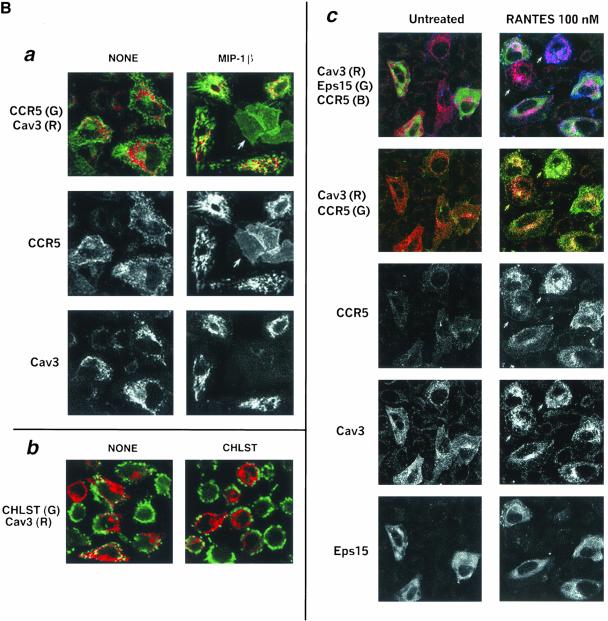
Figure 9B.
Overexpression of caveolin-3 (Cav3). Agonist-treated CCR5 is internalized into caveolin-positive vesicles by largely clathrin-independent pathways, and these cells display selective depletion of plasma membrane cholesterol. Antibody feeding with APC-conjugated 3A9 mAbs monitored the trafficking of CCR5 induced by the indicated agonists at 100 nm for 30 min. HA-tagged Cav-3 (Cav3) was detected by staining with biotin-conjugated anti-HA mAb, followed by Alexa 488– (a) or TR-(c) labeled neutravidin. Images reflect results of three experiments. R, red; G, green; B, blue. (a) Composite images of CCR5 (green) and Cav3 (red) are shown at the top, with the monochromatic images of CCR5 and Cav3 below. (b) Staining for cell surface cholesterol in Cav3 transfectants. Cells were fixed and stained for cholesterol (CHLST, green) by fillipin (10 μg/ml) and then permeabilized and stained for Cav3 (red). (c) Eps 15 mutant does not eliminate Cav3-enhanced endocytosis of ligand-occupied CCR5. HeLa cells were cotransfected with HA-tagged Cav3 (Cav3), GFP-tagged mutant EΔ95/295 of Eps15 (Eps15), and CCR5. Receptor endocytosis assay was as above except that cell surface–bound antibody was stripped by acid wash. Trichromatic, bichromatic, and monochromatic images are displayed from top to bottom.

