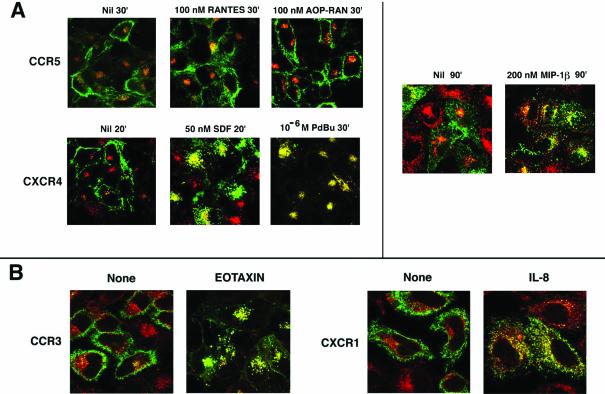
Figure 2.
Agonist-mediated CKR visualized by confocal microscopy. In all cases, Tfn-R endocytosis was monitored by Tfn-TR, shown in red. (A) Ligand mediated endocytosis of CCR5 and CXCR4 using HOS cell lines (images on the left) or HeLa cell transfectants (images on the right). CCR5 and CXCR4 were visualized by APC-labeled 3A9 and 12G5 mAb, respectively. The various ligand treatments and durations are denoted at the top of each image. Results represent three or four experiments. (B) Trafficking pattern of CCR3 and CXCR1 after exposure to their cognate ligands appropriately identified. Endocytosis assay was with HeLa cell transfectants. CCR3 and CXCR1 trafficking was visualized by use of FITC-conjugated mAbs. The respective agonists were used at 100 nM for 30 min. Results represent two experiments.

