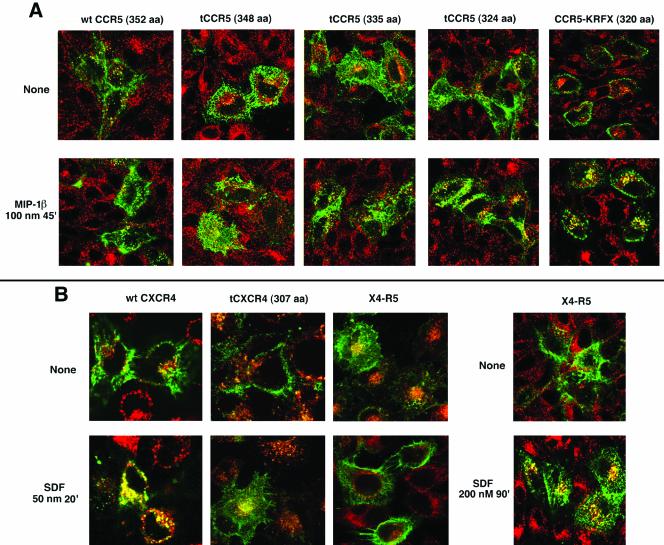
Figure 4.
Endocytic patterns of agonist-stimulated CCR5, CXCR4, and their derivatives. Tfn-TR monitored Tfn-R trafficking. The receptors are colored green and Tfn-R in red. Images representing three experiments are shown. (A) Endocytosis pattern of AOP-RANTES (100 nM, 30 min) treated or untreated transfectants expressing wt CCR5 and serial C-terminal truncations. 3A9-APC staining visualized CCR5. (B) Endocytosis pattern of SDF-1α (50 nM, 30 min) treated or untreated cells expressing wt CXCR4, tCXCR4, or X4-R5. CXCR4 was visualized by staining with 12G5-APC. Trafficking pattern of X4-R5 chimera treated with 200 nM SDF for 90 min is shown by the images on the extreme right.

