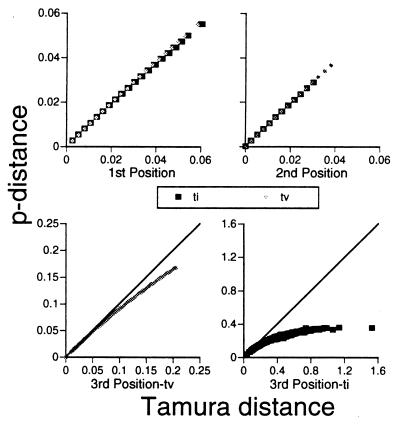
Figure 3.
Plots of uncorrected pairwise sequence divergence (p-distance) versus Tamura-corrected distances for transitions (ti) and transversions (tv) at first-, second-, and third-codon positions. Each plot presents all possible pairwise comparisons (703 data points). Deviation from the x = y line in the bottom two plots is a measure of the degree of saturation for the indicated class of substitution.

