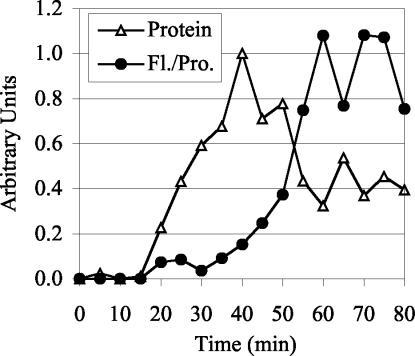
Figure 3.
Fluorescence intensity quantification and protein quantification of Spc110p-GFP during an induction time course. Spc110p-GFP in strain CRY1+pTY39 (GAL-SPC110-GFP) was induced by addition of galactose (4%) and after a 40-min induction, cycloheximide (0.5 mg/ml) and glucose (2%) were added to inhibit further protein synthesis. The experiment was performed twice with similar results. For each experiment the average nuclear fluorescence (subtracted for background cellular fluorescence) of >100 cells per time point was measured and normalized to the average intensity from 55 to 75 min. The Spc110p-GFP protein levels detected by Western blot analysis were averaged and normalized to the 40-min time point. The normalized data sets were then averaged to yield the data presented.

