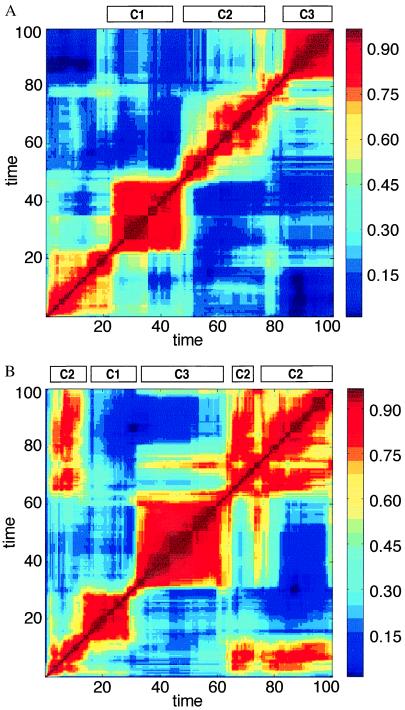
Figure 2.
A time correlation matrix for H values (Eq. 2), where the ordinate and the abscissa represent np and nq, compositional vectors at different points in the time-dependent evolution of a particular assembly. In this case H for nearly disposed time steps assumes the meaning of degree of homeostasis. Red colors signify higher H value (bar on right). (A) The H matrix for the run shown in Fig. 1 C and D. The four main red squares around the diagonal signify time intervals in which the composition does not undergo major changes (QSSs). The bars labeled C1, C2, and C3 are defined by the maximal similarity between the composition at a given time point and one of the three major composomes of Fig. 3. Intercomposome dissimilarity is displayed as blue off-diagonal areas (low H values). A statistical analysis of the lifetimes of different composomes revealed an exponential distribution, probably related to the Poissonian nature of the mutation-like compositional changes. In computer simulation that encompass 20,000 growth and split steps, the following prevalences were observed: C1, 0.13; C2, 0.37; C3, 0.50. (B) The influence of different initial conditions is seen in a different run with the same kinetic parameters but with a different initial composition. The H matrix displays off-diagonal red rectangles, representing compositions that emerge more than once.

