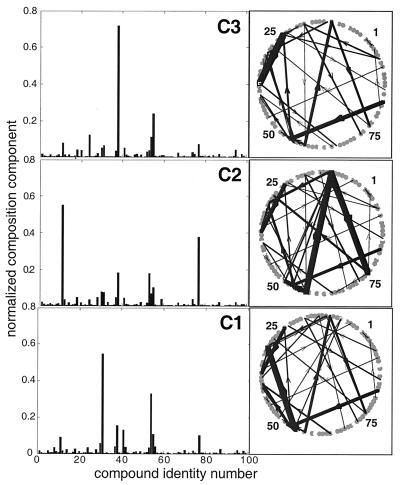
Figure 3.
The compositions and “metabolic” networks for the three composomes of the previous figures. A fuzzy c-means clustering algorithm of matlab was applied to a data set of 1,000 compositions sampled immediately after split events. (Left) Histograms represent normalized molar fractions at the cluster centers. (Right) The respective “metabolic” networks, where the width of each arrow represents the effective strength of the catalytic enhancement, calculated as nj⋅βij (arrows with nj⋅βij<20 are omitted).

