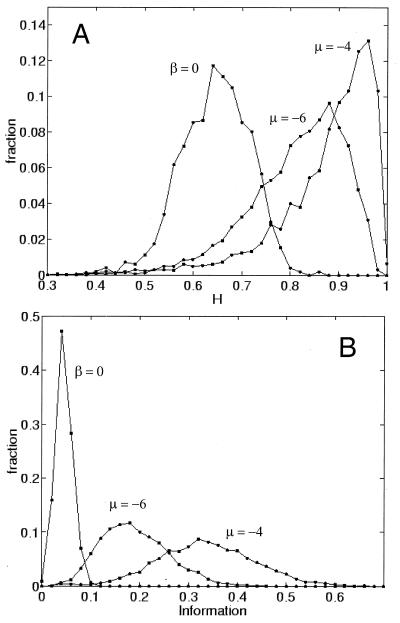
Figure 4.
Probability distributions for assembly characteristics as a function of the degree of mutual rate enhancement. β = 0 indicates no catalysis; medium and high catalysis (μ = −6 and μ = −4, respectively) represent β matrices sampled from normal distributions of the rate enhancement factors with the indicated mean and a SD of 4 (see legend to Fig. 1). Each distribution is computed for 4,000 assemblies, and values are sampled immediately after split events. (A) The homeostasis parameter H computed for pairs of parent and progeny. As the mutual rate enhancement is increased, H values shift form 0.65 ± 0.07, corresponding to random similarity values, through 0.81 ± 0.10 for low catalysis and 0.88 ± 0.10 for high catalysis, showing that the denser catalytic networks also are characterized by a higher level of average homeostasis. This finding indicates that a larger fraction of the assemblies tend to transmit their unique composition to their progeny. (B) The information or compositional bias parameter I. When there is no catalysis, I assumes very low values (0.05 ± 0.02), corresponding to low-information assemblies near thermodynamic equilibrium. The introduction of mutual rate enhancement leads to an appreciable increase in the information content to 0.19 ± 0.07 (μ = −6) and 0.34 ± 0.10 (μ = −4) (the maximal value of I is 1).

