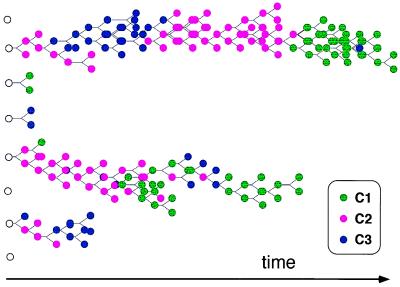
Figure 5.
An evolutionary tree for a population of assemblies. The total number of assemblies is kept constant at a population size W = 8. The color coding is according to the three clusters presented in Fig. 3, as indicated in the Inset. Open circles represent the random initial compositions used to seed the population. The length of the lines from a parent assembly to its progeny is proportional to the time taken to reach splitting size. Circles without progeny depict assemblies that were destroyed. The simulation parameters and the time scale are as in Fig. 1.

