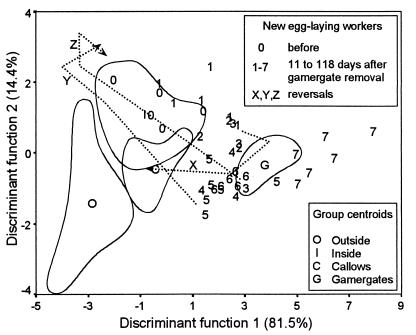
Figure 3.
The change of the hydrocarbon profiles of individuals that activated their ovaries. The discriminant analysis includes all members of colony A classified in four worker groups (gamergates, n = 9; callows, n = 9; workers from inside, n = 15; and from outside, n = 6). The differences in the CHC profiles of worker groups are illustrated by the respective encirclements based on the position of the individual group members similar to Fig. 2. Group centroids are marked. The change in the CHC profiles of those workers that started egg-laying after gamergate removal (new egg-laying workers) is indicated by numbers, which represent subsequent sampling periods (for respective sample days and size see Fig. 5). The change of the profiles of three workers that lost their rank (“reversals”) is indicated by dotted lines, whereas the arrows show the directions (worker X sampled at days 48, 52, 58, and 67; Y at days 46, 56, 66, and 74; Z at days 50, 60, 65, and 72).

