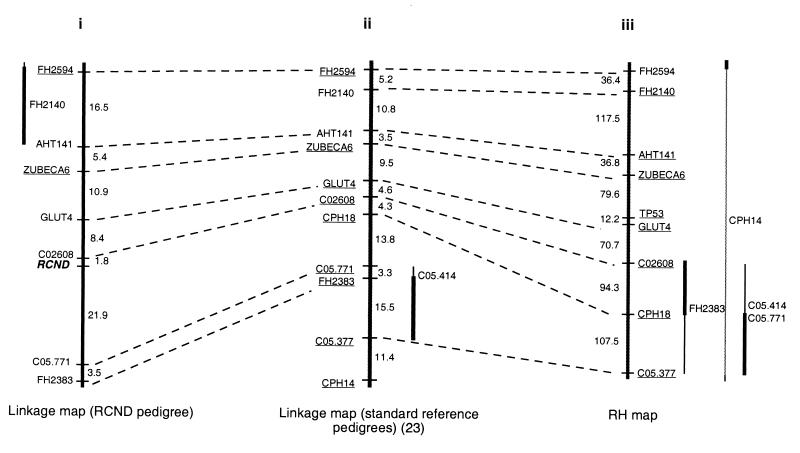
Figure 2.
Comparison of maps of CFA5 constructed with (i) linkage data from the RCND pedigrees, (ii) the standard reference pedigrees (23), and (iii) an RH panel. The distances on the linkage map are shown in centimorgans, and the distances on the RH map are shown in centiRays. All markers were assigned to CFA5 with odds of at least 100,000:1 and ordered with odds of at least 10:1. The most likely position or positions of markers that could not be positioned with odds of at least 10:1 are indicated with vertical bars to the sides of the maps. Thickened portions of bars indicate an interval that is favored over other intervals with odds of at least 10:1. Markers that can be ordered with odds of at least 1,000:1 are underlined.

