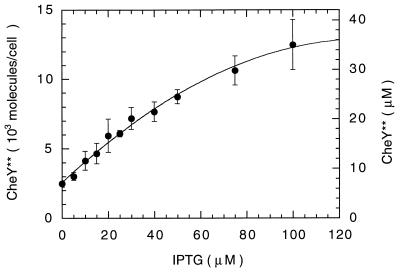
Figure 2.
Induction of CheY**. At least six immunoblots (24 samples) were analyzed for each induction level. The error bars are standard deviations of the means of each immunoblot. The line is a polynomial fit. Ng of CheY** were determined at each IPTG level and the molecules per cell were computed from the molecular mass (14.3 kDa) and the measured cell density (6.2 × 10⁸ cells per ml). Corresponding concentrations were computed from the measured dry weight/ml cell culture (0.26 mg) and the cytoplasmic volume/mg dry weight (1.4 μl, ref. 32).

