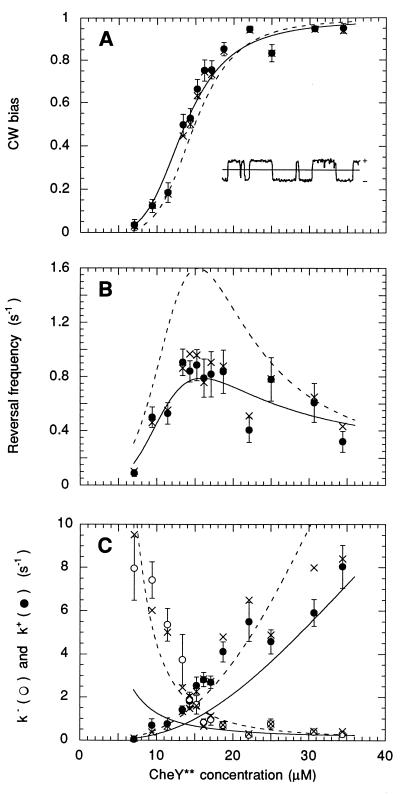
Figure 3.
Behavioral effects of induction of CheY**. The circle values were obtained by measuring the bias and reversal rate for each cell, computing k+ and k− for each cell, and taking the means (and standard errors) over the cell population (at least 30 cells at each level of induction). The × values were obtained from exponential fits to interval distributions (where possible), computing the bias and reversal frequency for each cell, and taking the means over the cell population (with fewer than 30 cells at low and high bias, where reversal frequencies were infrequent). The dashed line values were obtained from fits of the model mechanism to k+ and k− (Fig. 4). The solid line values were obtained from fits of the model mechanism to CW bias and reversal frequency. See the text. (Inset) A segment of an angular speed record spanning 10 sec; CCW is +.

