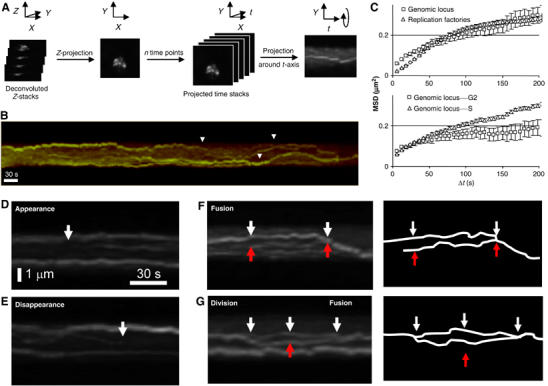
Figure 4.

In vivo dynamics of EGFP-PCNA-tagged replication factories. (A) A scheme for the construction of individual kymograph is shown: each 3D image stack taken at 6-s intervals, fluorescence is deconvolved, then z-projected. Time stacks are built from z-projections and projected around t axis. (B) Kymograph over 10 min of an individual fission yeast nucleus showing the EGFP-PCNA transition from pattern c–d at 30°C. Large movements can be observed (arrows) for individual replication factories (see Supplementary movies 2 and 3). (C) MSD analysis on aligned nuclei compares the movement of individual EGFP-PCNA spots (diamonds, n=20) with that of a lacO-tagged late replicating genomic locus (ars2.1; (Kim and Huberman, 2001), squares, n=6). In the upper graph, we see that the MSD plateau of a genomic locus and of replicating foci are similar, and we calculate a radius of constraint for each as 0.65 μm (Gartenberg et al, 2004). The diffusion coefficient (Dmax) reflects the initial slope of the curve, indicating that replication factories diffuse less rapidly. The lower panel compares the same genomic locus in G2- and S-phase cells, indicating a significant restriction in the radius of constraint in G2 phase. (D, E) Enlargements of kymographs of fission yeast nuclei in mid-S phase show the appearance (D) or disappearance (E) of an individual replication factory (arrows). (F) As panel D, but showing the merging of replication factories (arrows). (G) As panel E, but showing division and merging of one replication factory (arrows).
