
Figure 3.
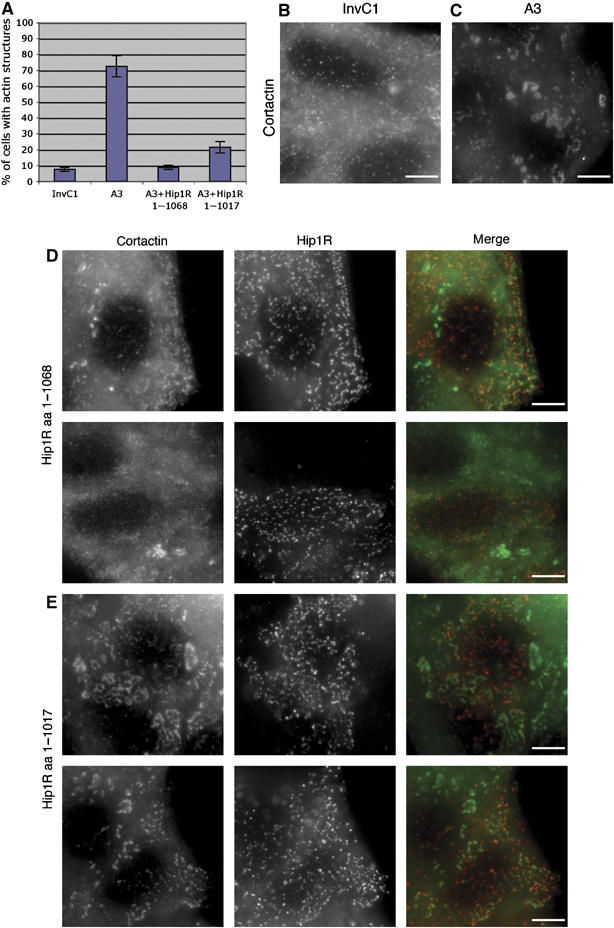
Hip1R–cortactin contributes to the regulation of actin assembly at endocytic sites. (A) The bar graph shows the percentage of HeLa cells showing abnormal actin structures after treatment with Hip1R siRNA duplex (A3), a control siRNA (InvC1), Hip1R siRNA and expression of wild-type Hip1R (A3+Hip1R 1–1068), Hip1R siRNA and expression of Hip1R 1–1017 (A3+Hip1R 1–1017). (B–E) Representative pictures of cells. (B) Cortactin staining in control siRNA (InvC1)-treated cells. (C) Cortactin staining in Hip1R siRNA (A3)-treated cells. (D–E) Representative pictures of non-rescued cells with remaining abnormal actin structures. (D) Hip1R siRNA-treated cells expressing wild-type Hip1R (1–1068). (E) Hip1R siRNA-treated cells expressing mutant Hip1R 1–1017. Cortactin staining (left panels), Hip1R staining (middle panels), merge (right panels). Scale bars are 10 μm.