
Figure 4.
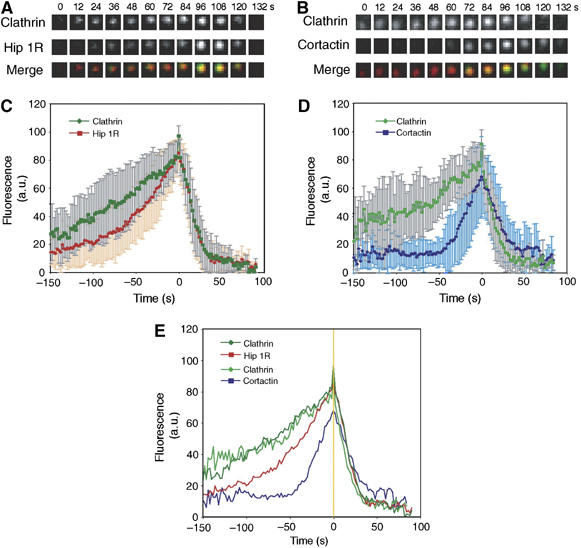
Timing of Hip1R and cortactin recruitment to CCPs. (A) Time series showing DsRed-clathrin and Hip1R-GFP recruitment to the same CCP. (B) Time series showing DsRed-clathrin and cortactin-GFP recruitment to the same CCP. (C) Average fluorescence of clathrin (dark green) and Hip1R (red) plotted against time from 30 CCPs in eight cells. The error bars represent the s.d. from 30 events. Time 0 corresponds to the moment at which the clathrin signal started to dim. All data were normalized (see Materials and methods) before averaging. (D) Average fluorescence for clathrin (light green) and cortactin (blue) plotted against time from 30 CCPs in 14 cells. (E) Summary of panels C and D without the error bars. Time 0 is marked by a yellow line.