
Figure 3.
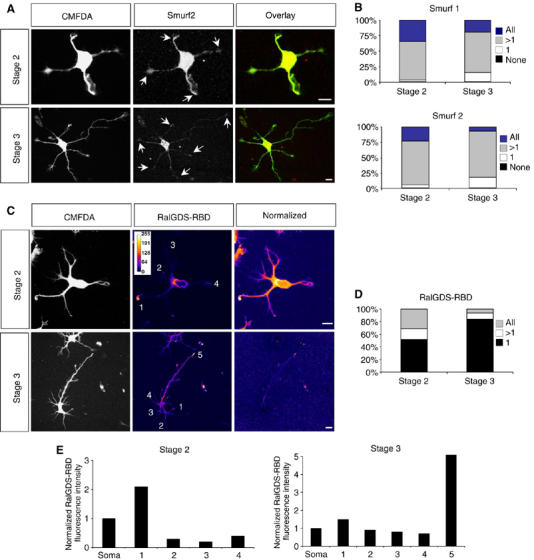
Distribution of Smurf1 and Smurf2 and active Rap1B during neuronal differentiation. (A, B) Hippocampal neurons were fixed at stage 2 or 3 and stained with anti-Smurf1 (not shown) or anti-Smurf2 antibodies (A, red). Neurons were analysed by confocal microscopy. Projections of z-stacks that contained the complete cell are shown. The immunofluorescence signals were normalised for cell volume by labelling with CMFDA (A, green). The percentage of cells that contain Smurf1 (B, top) or Smurf2 (B, bottom) in all, several (>1; the axon and one or more minor neurites in stage 3), one (1; the axon in stage 3), or none of the neurites is shown. Arrows indicate staining at the tips of neurites. At stage 2, 71±5% of the cells contained Smurf2 in more than one but not all neurites, 23±3% in all neurites. 5±2% of the neurons showed Smurf2 in a single and 1±1% in none of the neurites (n=75; three experiments). At stage 3, Smurf2 was restricted to the axon in 17±3% of the cells (1). 7±1% contained Smurf2 in all growth cones and 75±5% in the axon and one or more minor neurites in addition (>1; n=150; three independent experiments). For each growth cone, the normalised fluorescence intensity was calculated as the ratio of the fluorescence intensities of Smurf1 or Smurf2 and CMFDA in the growth cone. A growth cone was scored as positive for Smurf1 or Smurf2 if the value for the relative fluorescence intensity was at least three times higher than the value for the background. Scale bars are 12 μm. (C–E) Hippocampal neurons were fixed at stage 2 or 3, incubated with bacterially expressed GST-RalGDS-RBD that specifically binds Rap1B-GTP, and bound GST-RalGDS-RBD detected in situ with an anti-GST antibody. The immunofluorescence signals were normalised for cell volume by labelling with CMFDA. The intensity of fluorescence (RalGDS-RBD) and the normalised fluorescence intensity (normalised) were colour-coded. The normalised fluorescence intensity was calculated as the ratio of the fluorescence intensities of RalGDS-RBD and CMFDA in the growth cone. Blue indicates weak staining, white strong labelling. The distribution of RalGDS-RBD binding sites, indicating active Rap1B, was analysed by determining the percentage of cells that showed binding in all, several (>1; the axon and one or more minor neurites in stage 3), or one (1; the axon in stage 3) of the neurites (D). (E) The normalised immunofluorescence intensity (arbitrary units) in the growth cones marked in (C) is shown. A growth cone was scored as positive for active Rap1B when the normalised fluorescence intensity was at least double the value of that in the soma.