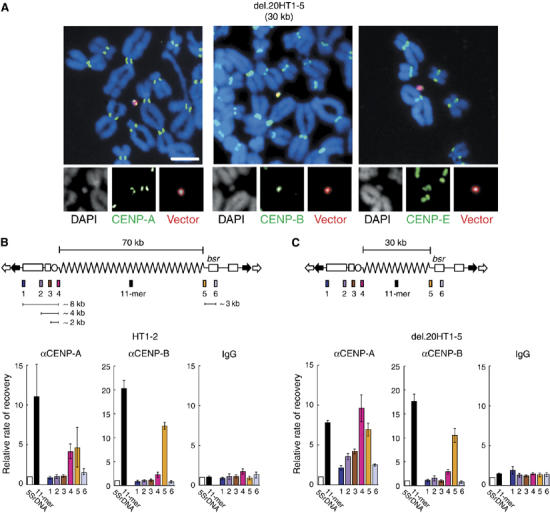
Figure 3.

Analysis of CENP-A chromatin in HACs. (A) Indirect immunostaining and FISH analysis of del.20HT1–5. Green fluorescent secondary antibodies were used to detect CENP-A, -B or -E. Red fluorescent signal indicates hybridization to YAC vector probes. Scale bar, 10 μm. (B, C) ChIP and real-time PCR analysis of HAC cell lines 7C5HT1–2 and del.20HT1–5. The diagrams of YAC structures indicate one unit of the concatenated multimers found in HACs. Relative enrichment of YAC regions 1–6 was quantified as described. Results were normalized to 5S ribosomal DNA and are presented as a bar graph. Normal IgG was used as a negative control. Error bars indicate s.e.m. (n=3). Enrichment of CENP-A in regions 4 and 5 in (B) and in regions 2–5 in (C) was statistically significant (P<0.01) by χ2 test, relative to values with normal IgG; values for regions 1, 2, 3 and 6 in (B), and regions 1 and 6 in (C) were not statistically significant (P>0.10) by χ2 test.
