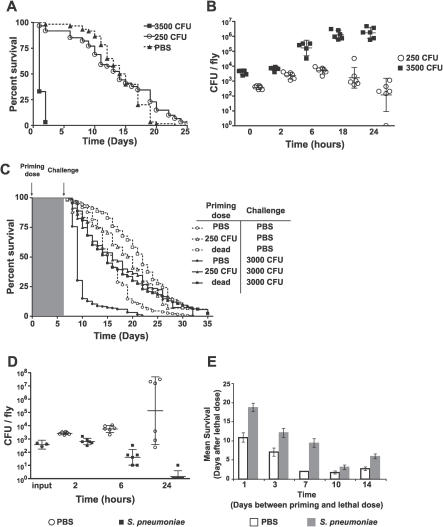
Figure 1. Protection from a Priming Dose of S. pneumoniae Persists for the Life of the Fly.
(A) Survival curves of flies injected with PBS (triangles, n = 60) or 250 (circles, n = 60) or 3,500 (squares, n = 65) CFU S. pneumoniae. p < 0.001, comparing 3,500 CFU to the other treatments (log-rank analysis).
(B) Flies were injected with 250 (circles) or 3,500 (squares) CFU of S. pneumoniae. Bars represent geometric means of bacterial load with 95% confidence intervals.
(C) Flies were primed on day 0 with PBS (circles), 250 CFU of S. pneumoniae (triangles), or dead S. pneumoniae (squares). One week later, flies were injected again with either PBS (open shapes) or 3,000 CFU S. pneumoniae (filled shapes). Naïve PBS-injected flies challenged with 3,000 CFU of S. pneumoniae die significantly faster than flies primed with 250 CFU of S. pneumoniae or dead S. pneumoniae (p < 0.0001, log-rank test). Dotted lines correspond to double injection controls. n = 158 to 228 for each condition.
(D) Flies were injected with PBS (circles) or dead S. pneumoniae (squares) on day 0 and challenged 1 wk later with 400 CFU of S. pneumoniae. Bars represent geometric means of bacterial load with 95% confidence intervals.
(E) Flies were primed on day 0 with PBS (open bars) or dead S. pneumoniae (filled bars) and challenged with 5,000 CFU of S. pneumoniae on the indicated days. Mean survival with standard error values are plotted. n = 37 to 49 for each condition. At each time point, the survival curves differ significantly. See Figure S1 for log-rank analysis and individual survival curves.

