
Figure 1.
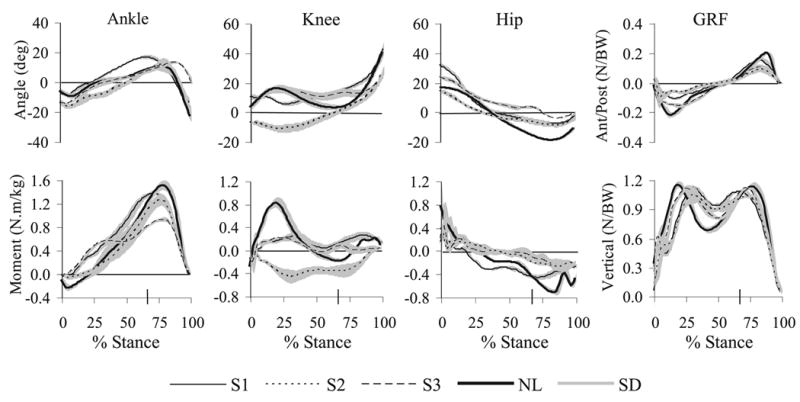
Results from the gait analysis as a percent of stance phase for the 3 subjects with weakness (S1–S3) and the unimpaired subject (NL). Joint angle is in the top row and flexion angles are positive. Joint moments are in the bottom row and internal extensor moments are positive. Ground reaction forces are shown on the far right, with anterior on the top, and vertical (upward) on the bottom being positive. Results represent the mean (and standard deviation, gray lines) of 4 repeated trials per subject, except S3 contributed only 3 trials. The large tick mark on the horizontal axis is at 66% of stance phase and corresponds to the average time at which the induced acceleration analysis was performed.