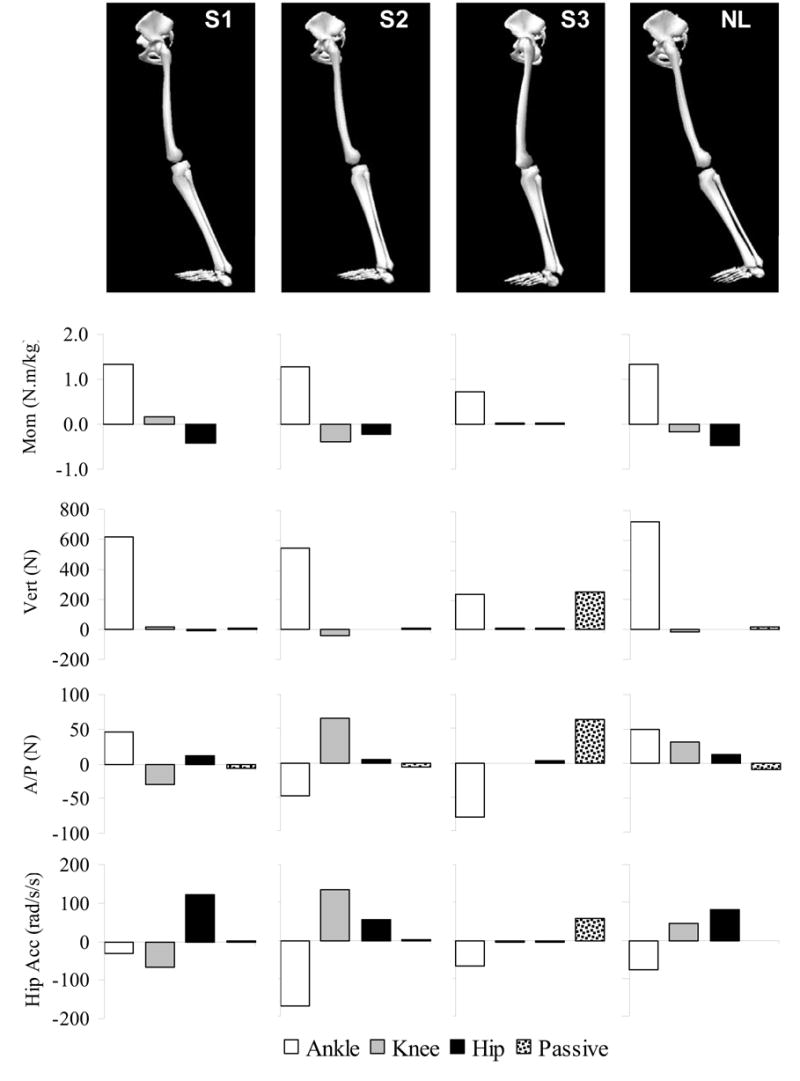
Figure 2.

Input to and results from the induced acceleration analysis for the 3 subjects with weakness (S1–S3) and the unimpaired subject (NL). From top to bottom, graphic showing input joint positions, input joint moments (internal extensor moments are positive), output vertical GRF (up is positive), A/P GRF (anterior is positive), and hip acceleration (flexion is positive). Output bar graphs show how much each input joint moment or gravity (passive source) contributed to producing upright support, forward progression, or hip joint acceleration.
