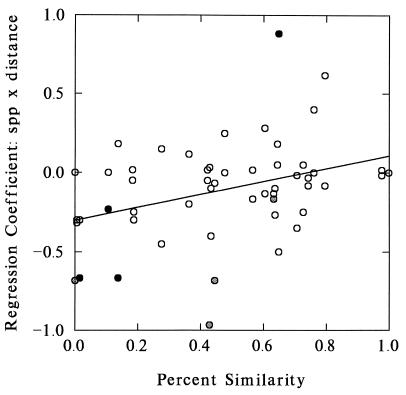
Figure 3.
Regression coefficients from analysis of species richness × distance from plot boundaries at the Rothamsted Park Grass experiments, plotted as a function of the botanical similarity of the adjoining plots. Plot similarity is expressed as percent similarity (Renkonen’s index) between pooled samples of all quadrats >2.5 m from each side of the boundary. Shaded symbols indicate transects with individually significant diversity × distance trends when no correction is made for multiple comparisons (light shading, P < 0.05; dark shading, P < 0.01). Note that, overall, regressions are much more often negative than positive, and that the most dissimilar plots tend to show the strongest (that is, most negative) effects.

