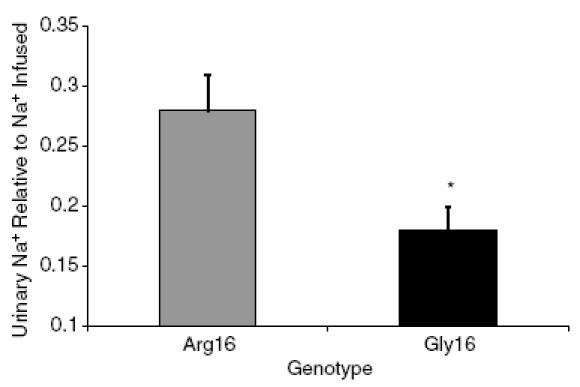
Figure 3. Urinary sodium excretion relative to sodium load with rapid saline infusion according to genotype.

relative Na+ excretion for the 3 h following rapid saline infusion in the Arg16 group (▒) and the Gly16 group (▪). *P < 0.01 Arg16 versus Gly16.
