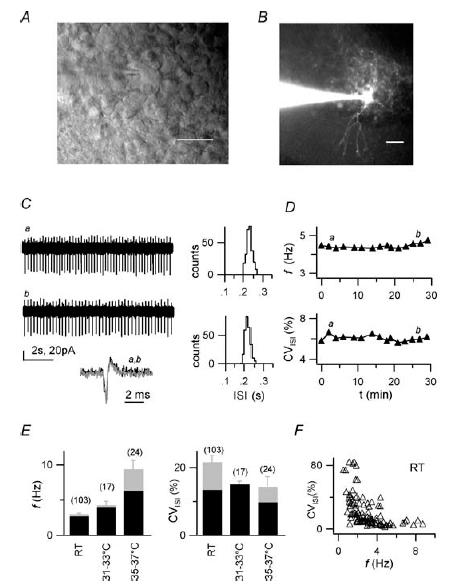
Figure 1. Spontaneous firing of cerebellar Golgi cells in loose cell-attached recordings.

A, DIC-IR image of the surface of a cerebellar slice. A patch pipette is in contact with a GoC in the granular layer. Scale bar: 10 μm. B, fluorescence image of a GoC filled with Alexa Fluor 488. Note the apical dendrites extending in the molecular layer (lower part of image) and the extended plexiform axonal arborization in the granular layer (upper part). Scale bar: 20 μm C, left: loose cell-attached (LCA) current traces showing spontaneous single-spike firing at the beginning (upper trace, a) and at the end (lower trace, b) of a 30 min recording (RT). Biphasic downward and upward deflections represent spikes. Inset: single superimposed spikes from traces a and b shown at higher time resolution to illustrate constancy of spike waveform. Right, interspike interval (ISI) distributions from 1 min time windows (‘1 min ISI distributions’) including trace a (upper histogram; mean ISI and CVISI: 231 ms and 6.1%) and trace b (lower histogram; mean ISI and CVISI: 218 ms and 6.0%). D, time course of firing frequency f (top) and CVISI (bottom) for the recording shown in C. Note the low variability, and stability of f and CVISI over time. Labels indicate time position of traces a and b shown in C. E, summary of f (left) and CVISI (right) statistics for a population of 103 cells at room temperature (RT), for 17 cells at 31–33°C and for 24 cells at 35–37°C. Grey bars: mean values ±s.e.m.; black bars: median values. F, plot of CVISIvsf for 103 cells studied at RT. Note the inverse correlation between CVISI and f (see text). All recordings in C–F obtained in standard extracellular solution.
