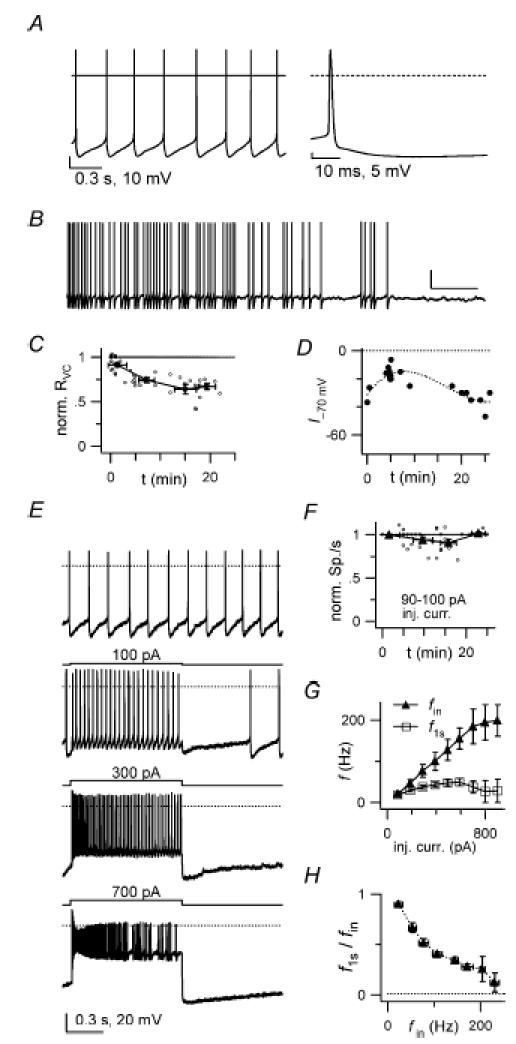
Figure 3. Whole-cell current-clamp GoC recordings.

A, left: autorhythmic firing (3.7 Hz) in a GoC with synaptic blockers present. Holding current (Ihold): 0 pA. Note the pronounced after-hyperpolarization after each spike. Horizontal bar: 0 mV level. Right: a spike from the left trace, displayed with higher time resolution. B, a longer voltage trace from another cell (Ihold 0 pA). Note the decrease in autorhythmic firing frequency occurring in the course of a few tens of seconds. Scale bars: 5 s, 20 mV. C, summary of apparent input resistance (RVC) values, measured from voltage-clamp steps between −70 and −80 mV (see Methods), collected from 11 cells and plotted vs experimental time. Values are normalized to RVC in the first minute after break-in. D, time plot of the current injection through the patch pipette needed to maintain Vm at ∼−70 mV (I−70) in a single cell. Note the initial I−70 increase, indicating membrane hyperpolarization, followed, after > 8 min, by progressive I−70 decrease, indicating subsequent depolarization. This behaviour was noticed in ∼50% of the cells. E, whole-cell (WC) current-clamp voltage traces showing responses of a GoC to 1 s-long step current injections of increasing amplitude, as indicated above traces. Top trace: Ihold 0 pA, autorhythmic firing, 6.6 Hz. Bottom two traces: note spike frequency adaptation for large current input. Dotted bar: 0 mV level. F, number of spikes during a 1 s-long step current injection of 90–100 pA (N90–100), as a function of time from break-in, normalized to the value in the first minute (54 data points from 9 cells; small open circles). Average N90–100 (filled symbols) decreases from 12.6 ± 1.0 spikes to 12.3 ± 1.0 spikes in the first 10–15 min (−2.9 ± 4.1%). G, frequency–current (f–I) relationships for six cells studied as in E. fin (filled symbols) and f1s (open symbols) are plotted vs injected current (inj. curr.). Ihold 0 pA; autorhythmic firing frequency: 3.2–7.1 Hz. H, ratio of f1s to fin, plotted vsfin, for the same six cells as in G. Note the progressive spike frequency adaptation with larger inputs.
