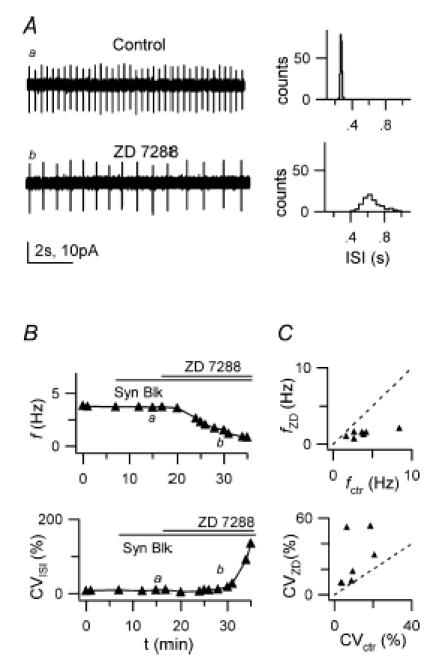
Figure 6. Block of Ih with ZD 7288 reduces firing frequency and precision.

A, left: LCA traces before (a) and after (b) bath application of 20 μm ZD 7288, in the presence of synaptic blockers. Right, 1 min ISI distributions for traces on the left. Mean ISI and CVISI: 270 ms and distribution 3.6% (upper histogram) and 653 ms and 16.4% (lower histogram). B, time course of f (upper plot) and CVISI (lower plot) for the recording shown in A, indicating a large f decrease and CVISI increase during drug application. Horizontal bars indicate times of synaptic blockers and ZD 7288 application; labels indicate time position of traces a and b shown in A. C, plot of f (top) and CVISI (bottom) in the presence of ZD 7288 (fZD, CVZD), vs respective values in control (fctr, CVctr), for 7 cells.
