
Figure 7. The M-type current agonist retigabine decreases cell excitability.
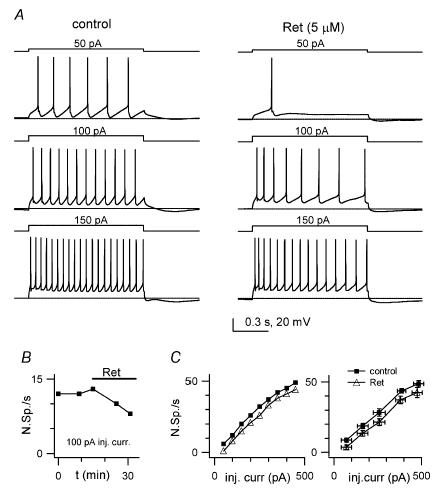
A, voltage traces from a current-clamp WC recording showing responses of a GoC to 1 s-long step current injections of increasing amplitude (indicated above traces), in control (left) and 15 min after 5 μm retigabine application (‘Ret’ right). Horizontal bars: −70 mV level. Note decreased spike numbers after drug for all step amplitudes B, number of spikes during a 1 s-long, 100 pA step current injection, as a function of time from break-in, for the experiment in A. The bar indicates retigabine application. C, number of spikes during a 1 s-long step current injection as a function of current amplitude, before (▪) and 15 min after retigabine application (▵). Left plot is for the same cell as above, right plot is a summary for 5 cells.