
Figure 2. Increasing the duration of a 50-Hz stimulus train prolongs the post-stimulation decay of mitochondrial [Ca2+] measured by changes in the fluorescence of X-rhod-5F.
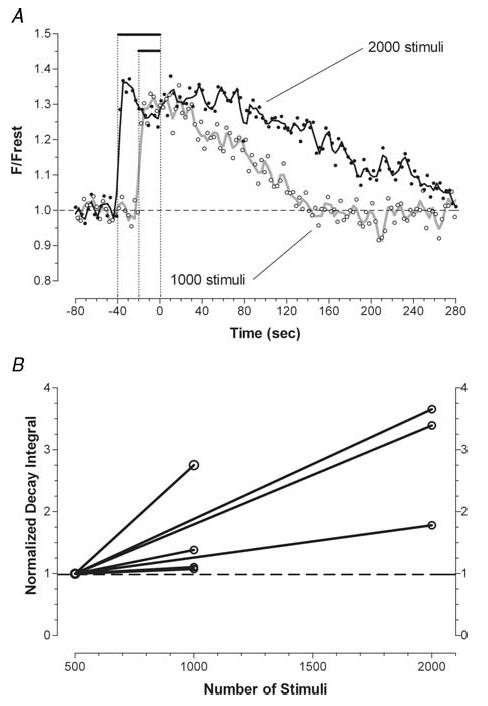
A, two trains (1000 and 2000 stimuli) were delivered sequentially to a single terminal. Curves drawn through the data points were calculated as the weighted average of the five nearest neighbours. The dotted vertical lines mark (from left to right) the beginning of the 2000 stimulus train, the beginning of the subsequent 1000 stimulus train, and the end of stimulation for both trains. B, pairwise comparison of the time integrals of the post-train decays of mitochondrial [Ca2+] measured after 1000 stimuli (n = 4 terminals) or 2000 stimuli (n = 3 terminals), normalized to those measured in the same terminal after 500 stimuli.