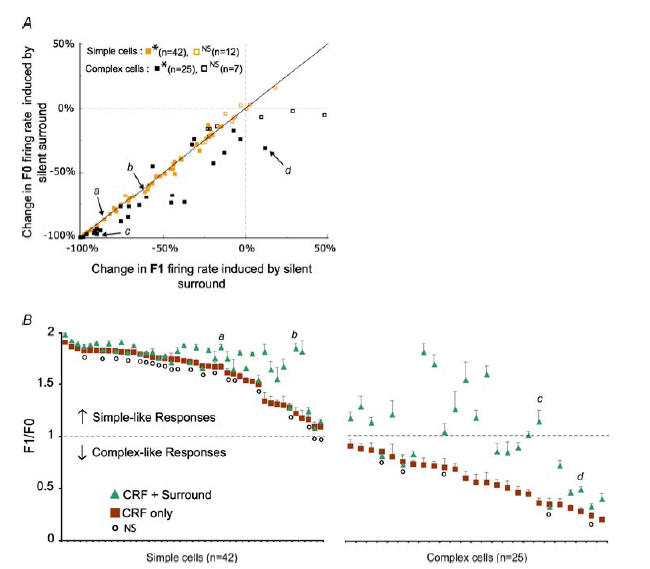
Figure 6. Effects of stimulation of silent surround on F1 and F0 firing rates and F1/F0 ratios.

A, plot of percentage changes in the magnitude of the F1 component of responses against the percentage changes in the magnitude of the F0 induced by activation of silent surrounds. For simple cells the significance of changes is calculated on the basis of changes in the magnitude of F1 components, while for complex cells the significance of changes is calculated on the basis of the changes in the magnitude of F0 components (Mann–Whitney test, *P < 0.05; non-significant, NS for P > 0.05). The letters a, b, c and d refer to the 4 examples illustrated in Fig. 5. B, the graph shows F1/F0 ratios for 67 cells in which at least one surround orientation evoked a significant (P < 0.05; Mann–Whitney test) reduction in the magnitude of responses. The F1/F0 ratios are not plotted for cases where the magnitude of response was reduced by surround stimulation to less than 1 spike s−1 and/or by more than 90%. The squares indicate the mean F1/F0 ratios (±s.e.m.) of responses to CRF stimuli alone, while the triangles indicate F1/F0 ratios of responses for the combination of CRF + surround that showed the maximum reduction in the magnitude of responses. The small circles indicate the cells without significant changes (NS) to the F1/F0 ratios of responses to CRF stimulation versus CRF + surround stimulation (P > 0.05; Wilcoxon test). Again, the letters a, b, c and d refer to the 4 examples illustrated in Fig. 5.
