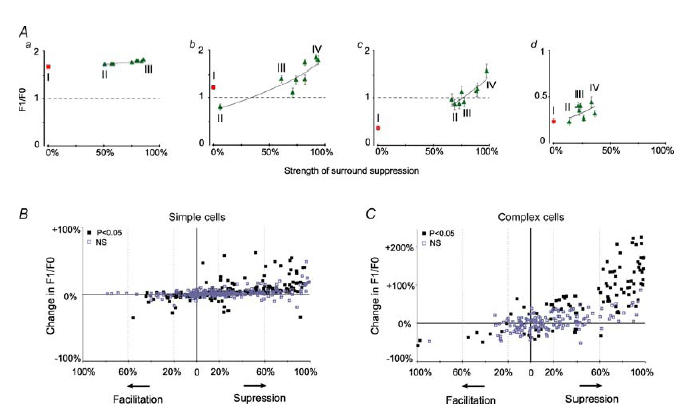
Figure 7. Relationship between the strength of suppression and charges in F1/F0 ratios.

A, graphs showing the F1/F0 ratios in relation to the strength of the surround-induced ‘suppression’ of the responses of 4 example cells (a, b, c and d) whose PSTHs are illustrated in Fig. 5. The F1/F0 ratios of responses to stimulation of CRFs alone are indicated by the squares while the F1/F0 ratios of responses to co-stimulation of CRFs + surrounds are indicated by triangles. B and C, relationship between the relative strengths of silent surround and percentage changes in the F1/F0 ratios induced by co-stimulation of CRFs and silent surrounds. Each point on the graphs indicates changes induced by one of 8 combinations of CRF + surround in each of 86 cells. The significance of the changes between the F1/F0 ratios of the responses to the stimulation of CRF alone and the F1/F0 ratios of responses to co-stimulation of CRF + surround was determined with the Wilcoxon test.
