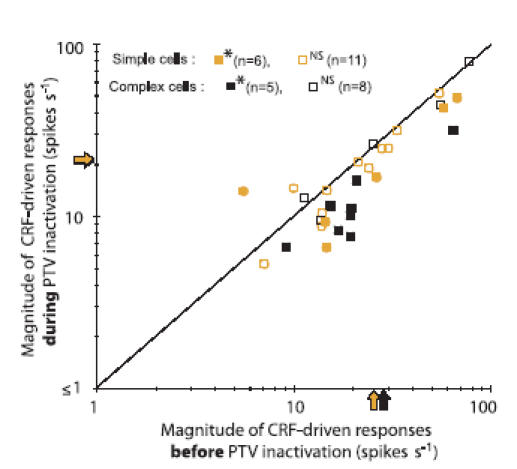
Figure 8. Effects of inactivation of PTV cortex on the magnitude of responses of V1 neurones to optimized sine-wave gratings restricted to the CRFs.

The magnitudes of responses (F1 for simple cells, F0 for complex cells) before inactivation of PTV cortex (PTV kept at 36°C) are plotted against the corresponding magnitudes of responses during inactivation of PTV cortex (temperature of PTV lowered to 10°C). The shaded and black arrows on the axes indicate, respectively, the mean F1 for simple and mean F0 for complex cells. Significance of changes between the two states was determined with Mann–Whitney test (*P < 0.05 and NS for P > 0.05).
