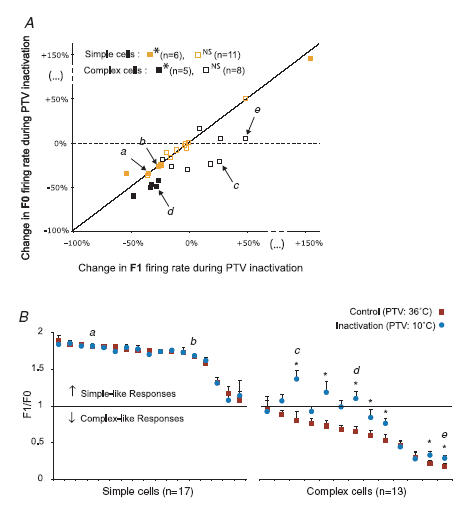
Figure 10. Effects of inactivation of PTV cortex on F1 and F0 firing rates and F1/F0 ratios.

A, percentage changes in the magnitude of phase-variant F1 components induced by reversible PTV inactivation versus the percentage changes in the mean firing rates, F0. The letters a, b, c, d and e refer to the 5 examples illustrated in Fig. 9. The significance of changes was determined with the Mann–Whitney test (*P≤ 0.05 and NS for P > 0.05). B, graph illustrating the F1/F0 ratios of area 17 cells tested before and during inactivation of PTV cortex. The squares and corresponding circles indicate, respectively, the mean ratio F1/F0 ±s.e.m. of the responses before and those during inactivation of PTV cortex. Again, the letters a, b, c, d and e refer to the 5 examples illustrated in Fig. 9. The asterisks indicate cells with significant changes in the F1/F0 ratios during inactivation of PTV cortex (P < 0.05; Wilcoxon test).
