
Figure 3. Reduction of NaP with riluzole.
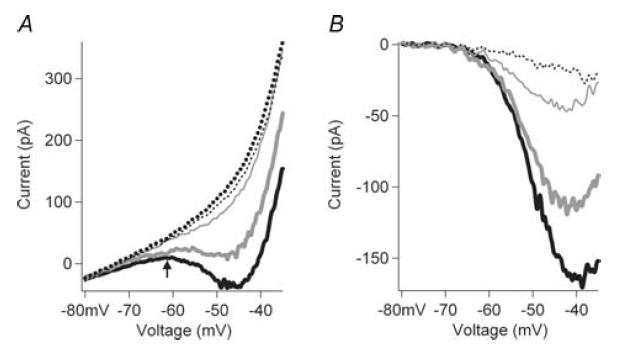
The I–V relations for NaP are shown for control conditions and for riluzole at three different doses (0.1, 1.0 and 5.0 μm) (thick grey line, thin grey line, dotted line), and after TTX administration (thick dotted line). A, Raw I–V functions. B, The control and riluzole currents after subtraction of the TTX I–V function. Increasing riluzole concentrations dose-dependently inhibited NaP.