
Figure 9. Effect of the rate of rise of the voltage command.
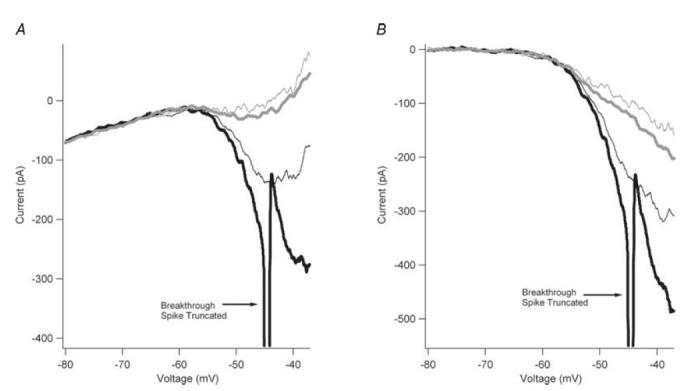
A, the I–V relations are shown for trials with rates of rise of 9 mV s−1 (thin grey trace), 18 mV s−1 (thick grey trace), 90 mV s−1 (thin black trace), and 180 mV s−1 (thick black trace). A single breakthrough spike (shown truncated) was observed with the trial using a voltage command of 180 mV s−1. B, the traces from A are shown leak- and TTX-subtracted to reveal the effect of rate of rise on NaP. By increasing the rate of rise of the voltage command, NaP was markedly increased, suggesting that NaP does slowly inactivate.