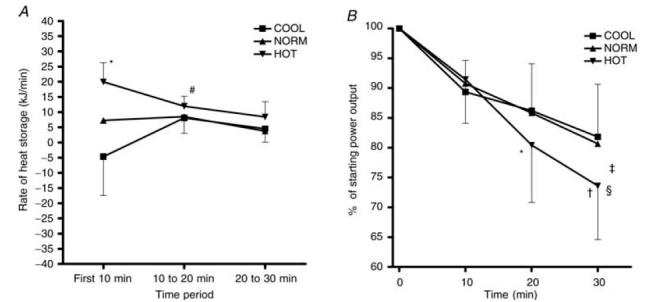
Figure 4. Heat storage (A) and power output expressed over 10-min intervals (B).

*Significantly different from COOL and NORM (P < 0.0005); #significantly different from first 10 min in HOT and COOL (P < 0.05); †significantly different from 20 min in HOT (P < 0.05); §significantly lower than in COOL at 30 min; ‡time main effect, decrease over time in all conditions (P < 0.005).
