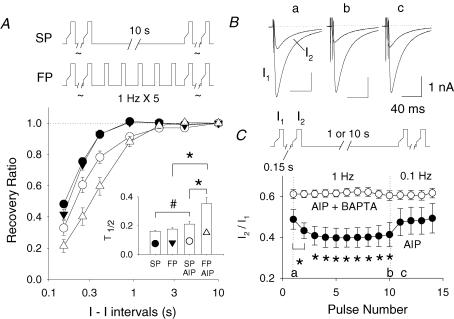
Figure 3. The effect of AIP is dependent on cycle length and [Ca2+]i.
A, the experimental protocols are shown at the top. Mean time courses of recovery from ICa−L inactivation measured during slow pacing (SP) and fast pacing (FP) conditions are shown with or without 2 μmol l−1 AIP treatment. See inset for symbol assignment. The inset shows the mean ICa−L recovery times, T0.5, of each groups (#P < 0.05; *P < 0.01). B, superimposed I1 and I2 traces of ICa−L before (a), during fast pacing at 1 Hz (b) and after pacing had slowed to 0.1 Hz (c). The currents were taken at the times marked in panel C (a–c). C, shows average dynamics of I2/I1 ratio during abrupt changes in pacing frequency. The experimental protocol is shown in the top panel. The I1–I2 interval was fixed at 0.15 s while the interpaired pulse interval was either 10 or 1 s. Two transitions were examined. After more than a 10-s rest, the interpulse interval was increased to 1 Hz for 10 pulses and then abruptly slowed to 0.1 Hz. The dynamics of the transitions of interpulse interval are plotted. *P < 0.01, when compared with the first I2/I1.

