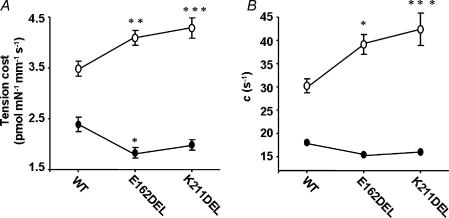
Figure 8. α- and β-MHC-induced differences in tension cost and XB distortion rate constant (c).
Tension cost was determined (A) from the slopes of tension–ATPase relationships as shown in Figs 6 and 7. The rate constant of distortion (c) was determined (B) as described in the Methods. For A and B (○) represents muscle fibres from normal rat hearts and (•) represents muscle fibres from PTU-treated rat hearts. For both A and B, WT represents WT-cTnT + cTnI + cTnC reconstituted muscle fibres; E162DEL represents cTnTE162DEL + cTnI + cTnC reconstituted muscle fibres and K211DEL represents cTnTK211DEL + cTnI + cTnC reconstituted muscle fibres. Number of determinations is at least eight for each. Standard error bars are smaller than symbols in some cases. Data were analysed using two-way ANOVA as described in the Methods. Subsequent post hoc multiple comparisons were made using a Holm-Bonferroni corrected t test (Glantz, 2002) to compare each mutation versus WT within PTU-treated and normal groups. *P < 0.05, **P < 0.01, ***P < 0.001.

